
Introduction.
We are going to cover the initial deployment of a Sentinel Workspace, and onboard the free data sources. Even though Microsoft lists the free data sources in the handy table shown below and available here, there are some caveats we need to be mindful of. The Microsoft documentation states;
“Although alerts are free, the raw logs for some Microsoft Defender XDR, Defender for Cloud Apps, Microsoft Entra ID, and Azure Information Protection (AIP) data types are paid.”
To give an example of what this means; MDE creates an alert based on the logs it ingests from endpoints, and can forward this alert for free to be ingested by Microsoft Sentinel, however Sentinel will not have the endpoint logs which caused the alert in MDE. To investigate this incident we would need to head over to https://security.microsoft.com. If we wanted to ingest the logs and events from MDE we would incur a cost, for example “DeviceNetworkEvents” or “DeviceLogonEvents”.
Table of free data types.
| Microsoft Sentinel data connector | Free data type |
|---|---|
| Azure Activity Logs | AzureActivity |
| Health monitoring for Microsoft Sentinel 1 | SentinelHealth |
| Microsoft Entra ID Protection | SecurityAlert (IPC) |
| Office 365 | OfficeActivity (SharePoint) |
| Office 365 | OfficeActivity (Exchange) |
| Office 365 | OfficeActivity (Teams) |
| Microsoft Defender for Cloud | SecurityAlert (Defender for Cloud) |
| Microsoft Defender for IoT | SecurityAlert (Defender for IoT) |
| Microsoft Defender XDR | SecurityIncident |
| Microsoft Defender XDR | SecurityAlert |
| Microsoft Defender for Endpoint | SecurityAlert (MDATP) |
| Microsoft Defender for Identity | SecurityAlert (AATP) |
| Microsoft Defender for Cloud Apps | SecurityAlert (Defender for Cloud Apps) |
It’s easy to start off trying to ingest way too much information and find the cost prohibitive. It can also become completely overwhelming and confusing when you enable lots of data connectors without fully understanding why you are connecting them. If this is your first foray then start small, start free, and build from there.
Deploy the Sentinel Workspace.
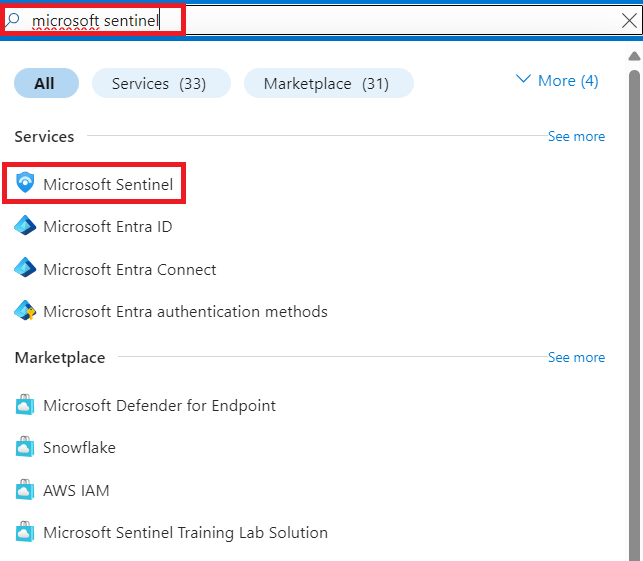
We head over to https://portal.azure.com > search for Microsoft Sentinel and select the appropriate option.
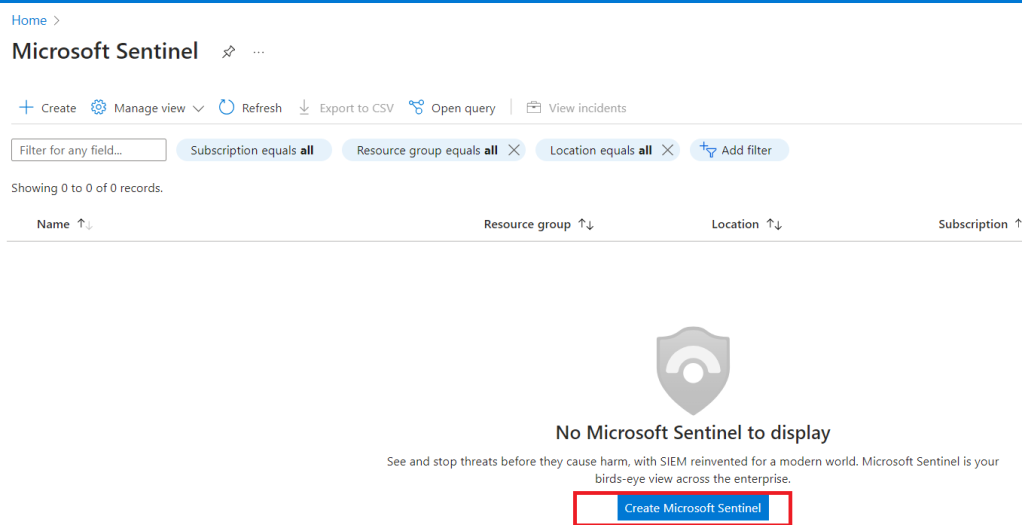
We are greeted by the below page which shows we currently have no Microsoft Sentinel Workspaces, and provides the option to create one. We select “Create Microsoft Sentinel”.
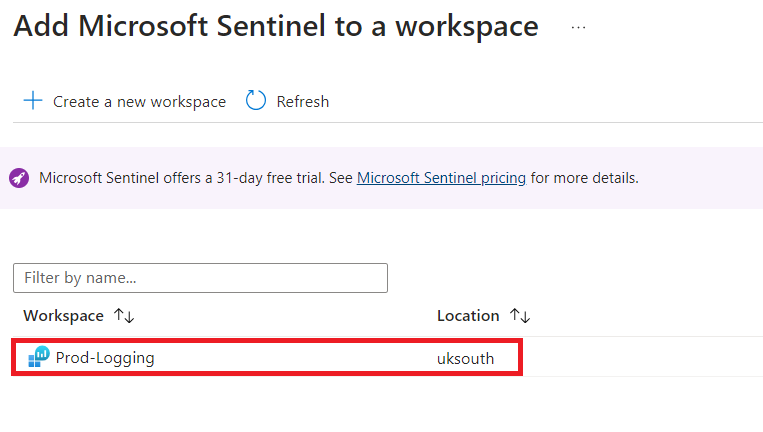
We then need to select which workspace we want to add Sentinel to. For us it’s the Production logging workspace we created in Part 1 of this series of blogs.
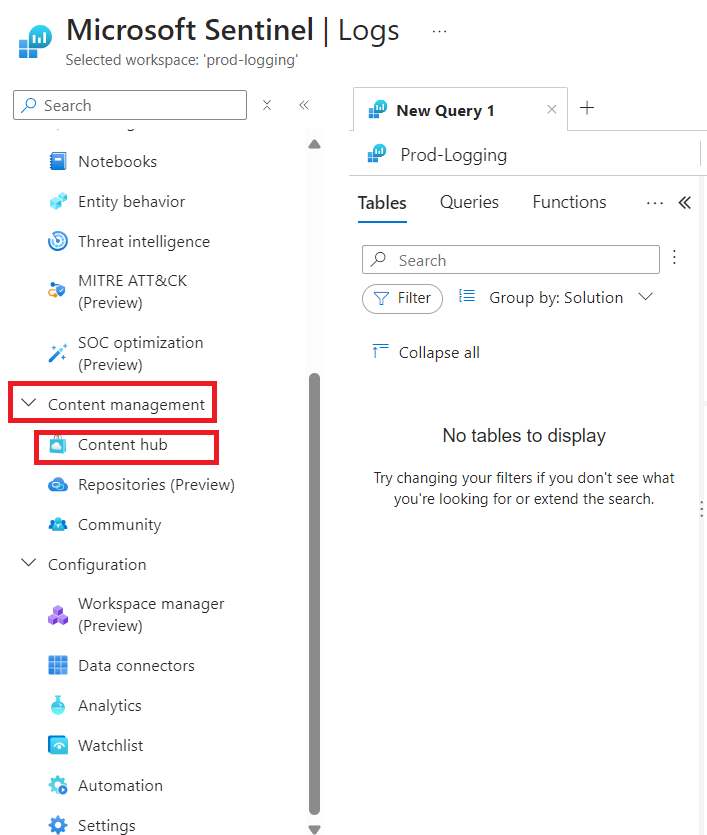
Once we receive the notification that deployment is completed we head over to Sentinel to start configuring some data sources and ingest some logs. From the Sentinel menu we select “Content Management” > “Content hub”.
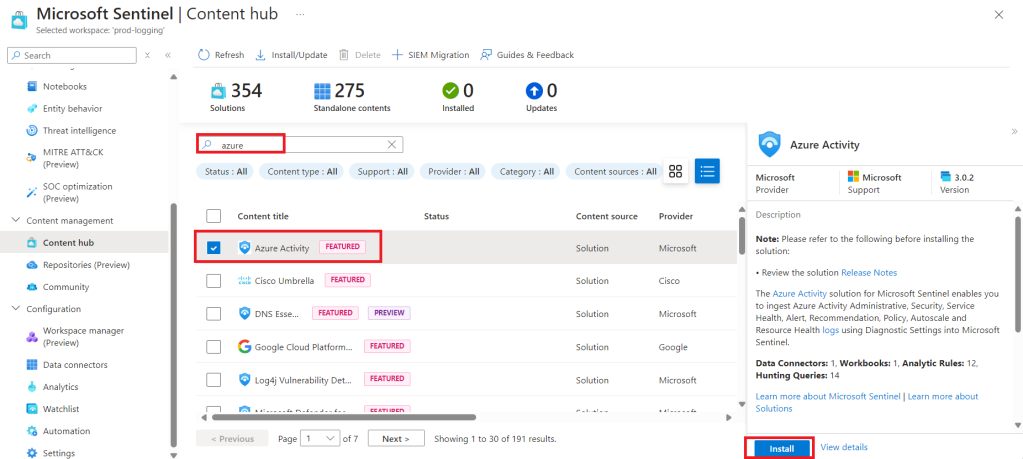
This will load the Content Hub, and allow us to search for the log sources we want. The first free data type in the table (provided by Microsoft) is Azure Activity, and if we search for “azure” we should see “Azure Activity”. We select this source and then select “Install” as highlighted below.
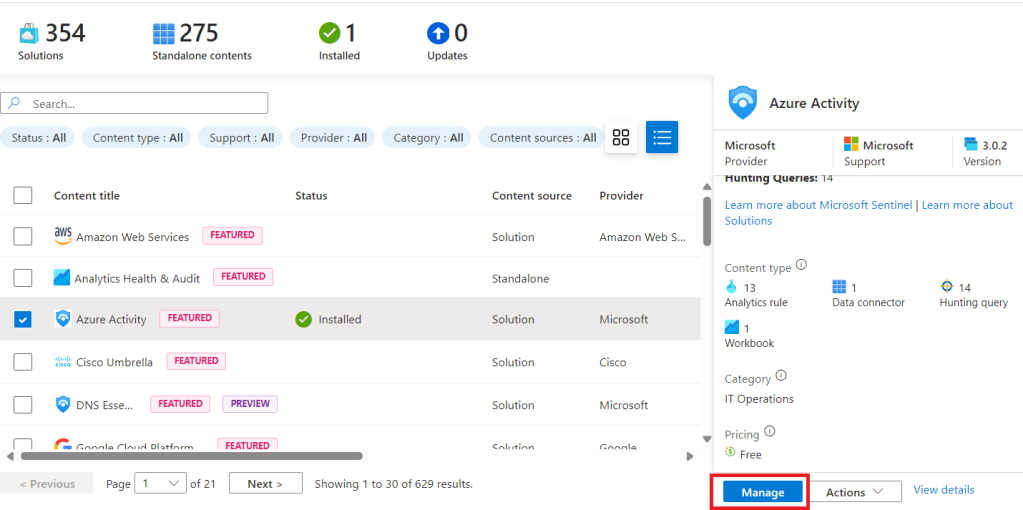
Once we receive the successful installation notification we go back to the Content Hub, and we should now see “Azure Activity” clearly marked “Installed” with a green tick. When we select “Azure Activity” we should now see a “manage” button where “Install” was previously. We select this option and head into the settings for this log source.
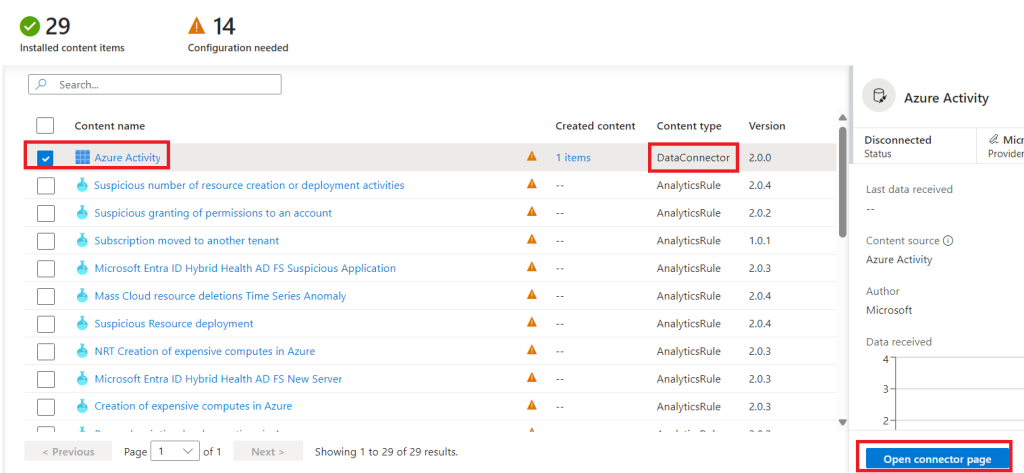
Initially we are only going to configure the data connector, so we tick the relevant box as shown below and select “Open connector page”.
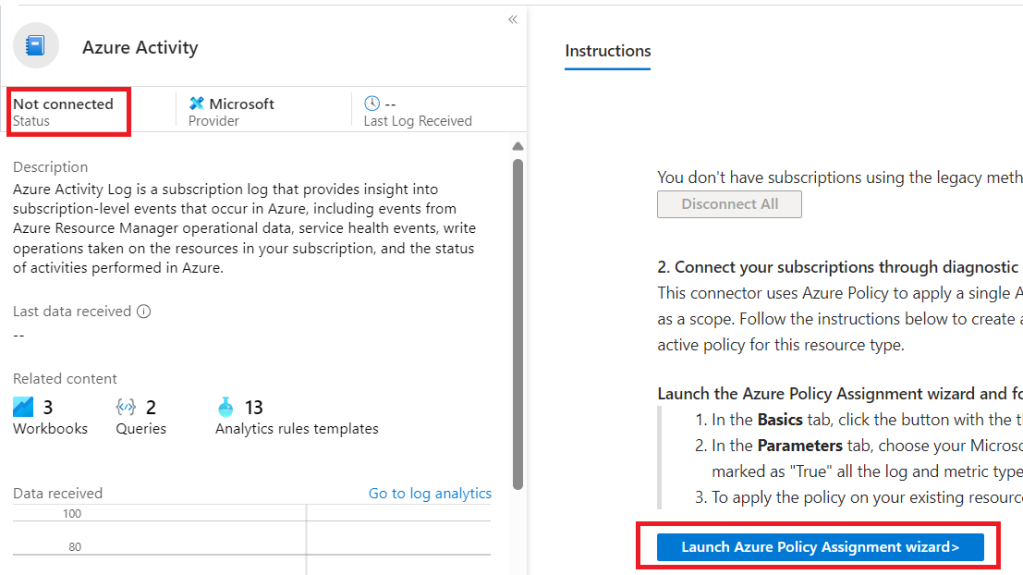
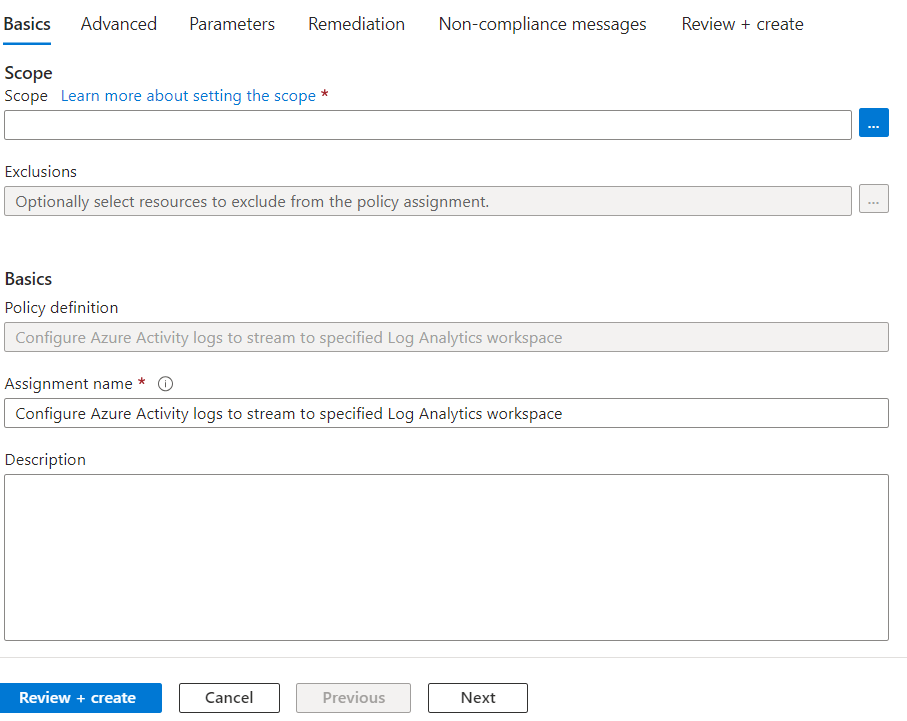
We can see that Azure Activity is not yet connected, so we need to launch the Policy Assignment wizard as shown below.
First set our scope which for us is our subscription, then hit next, skip past “Advanced” to “Parameters”.
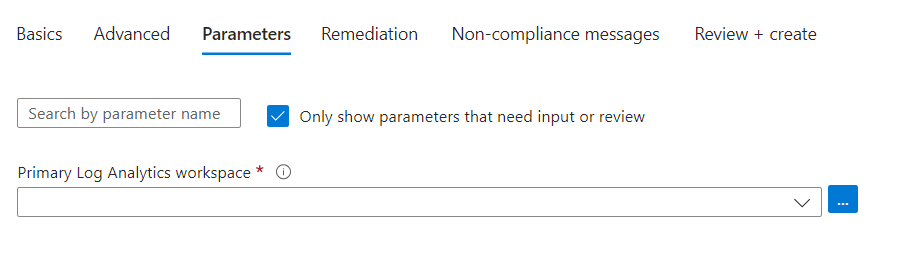
Select our Log Analytics Workspace, which for us is our Production Logging Workspace we created in part one of this series.
We skip to “Review and Create”.
And create our connector.
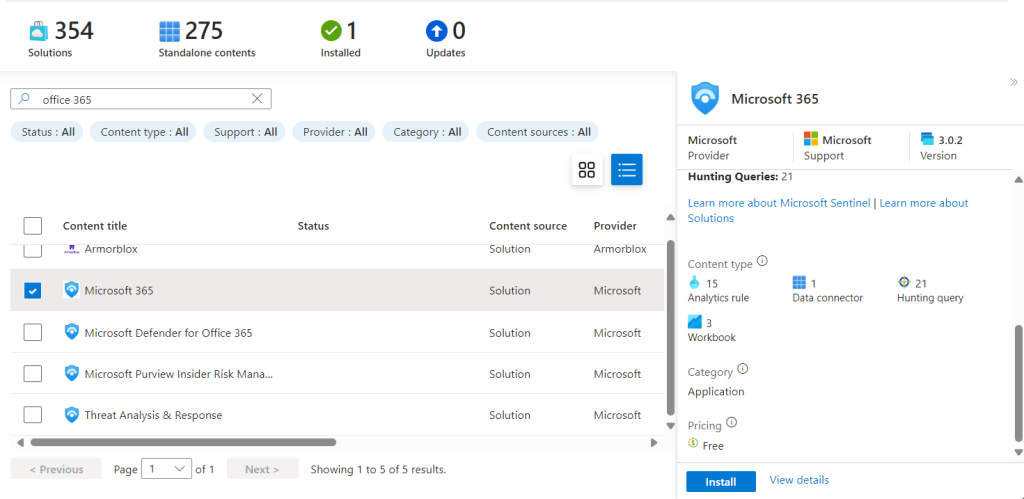
We now need to repeat the process for all of the free data sources, next is “O365”, so we follow the same steps to install the source. We then select the “Manage” option to configure the source, however this one has different configuration options.
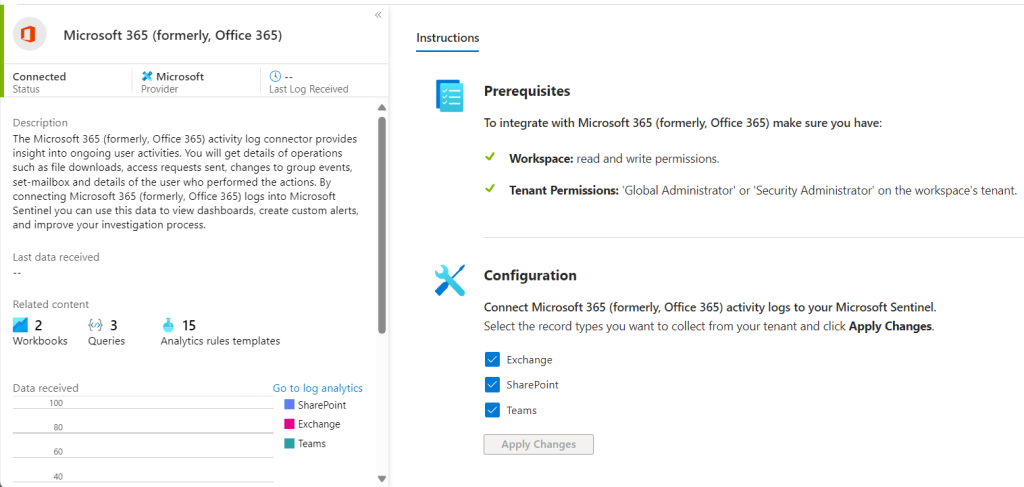
From the manage screen we need to select the “Data Source” option from the list.
Then select the sources we want to ingest. We select all three boxes below “Configuration” then hit the “Apply Changes” button to save our configuration.
We are now going to show how we can enable and configure an Analytics Rule which is linked to a log source. For the Microsoft 365 source we are going to enable the Malicious Mailbox Analytics Rule, and set it to run everyday and query the previous days data each time.
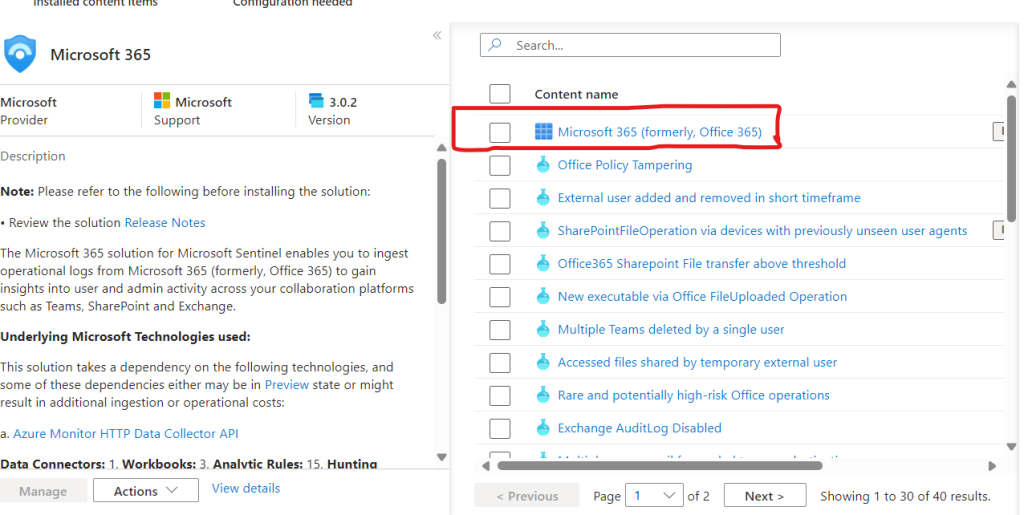
From the Content Hub we search for the “Microsoft 365” data source and select “Manage”.
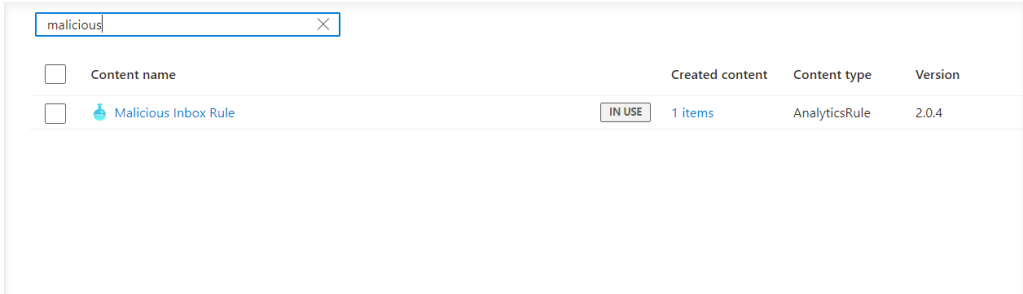
Search for “malicious” and we find the rule we want to enable and configure.
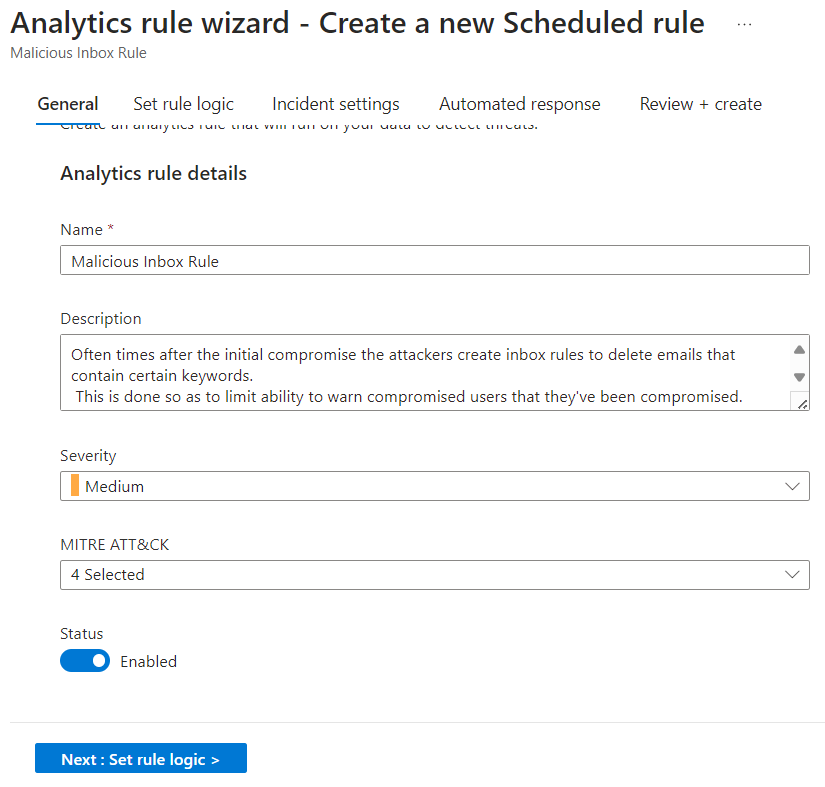
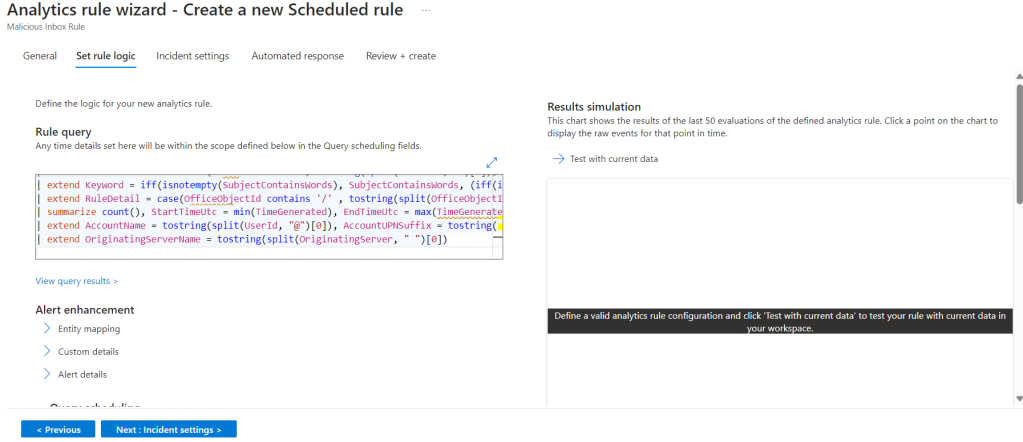
Using the Wizard we accept the defaults on the first page and move on to set the rule logic.
From here we can adjust the query, or even run a test with our current data. We will cover Analytic Rules more in depth in the future. For now we will be using basic settings to keep things simple.
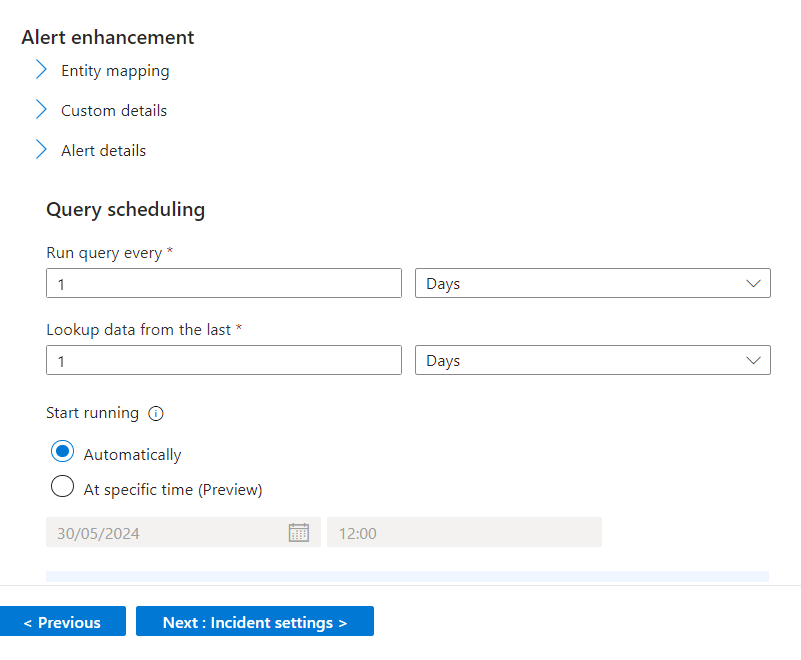
Still on the “Set rule logic” page we scroll down, set our schedule, the lookup period and for the rule to run automatically.
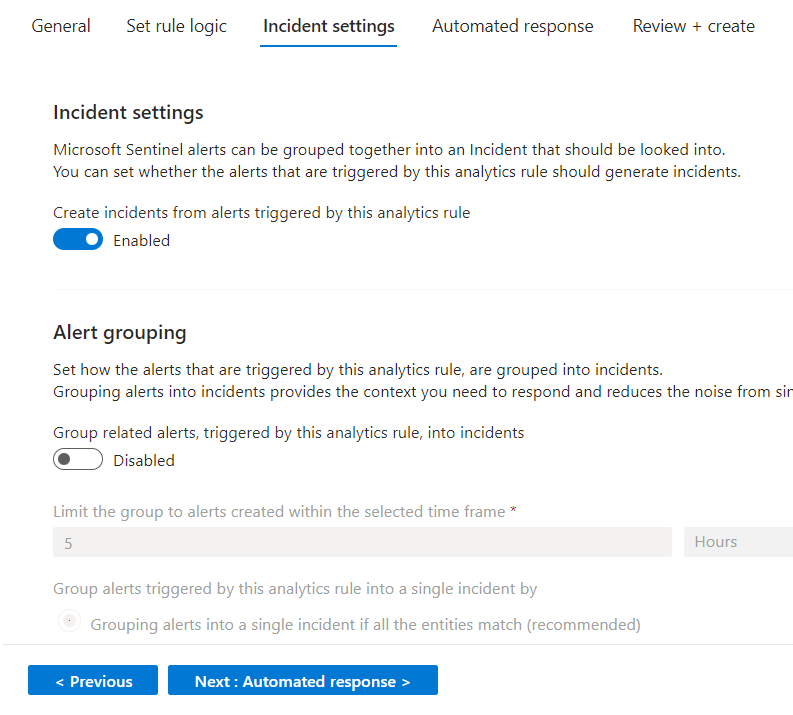
On the “Incident settings” page we want to create an incident in Sentinel whenever the rule creates an alert.
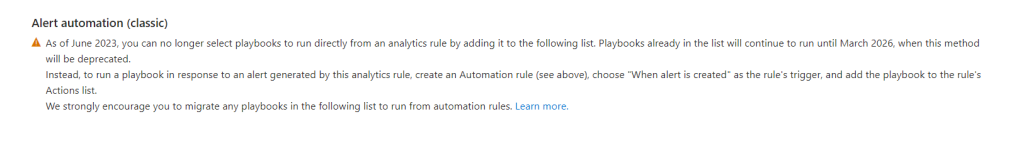
Next on the “Automated Response” page we can see that playbooks can no longer be added to run directly from here and that instead we need to create “Automation Rules” as per the instructions below. We are not creating automation for this rule at this point so we move onto “Review + create” and save our new Analytics Rule..
We can repeat this process for any of the rules in the list from the same manage page. We can also create Workbooks which display the data from our data source.
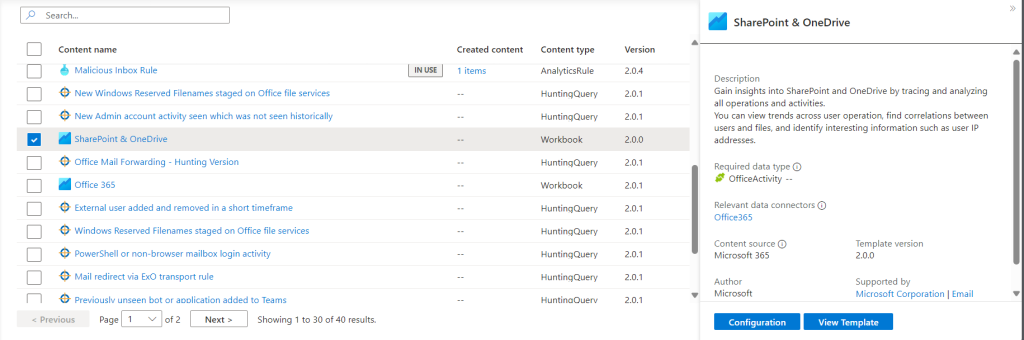
With Workbooks you can chose the Workbook location if you have any compliance requirements for the data being ingested, stored and displayed. Again this is a simple process.
Now we repeat all the previous steps for all the data sources within the Microsoft table we covered at the beginning of this guide. We continue to search the content hub for the relevant data sources and install them and any rules we want to enable.
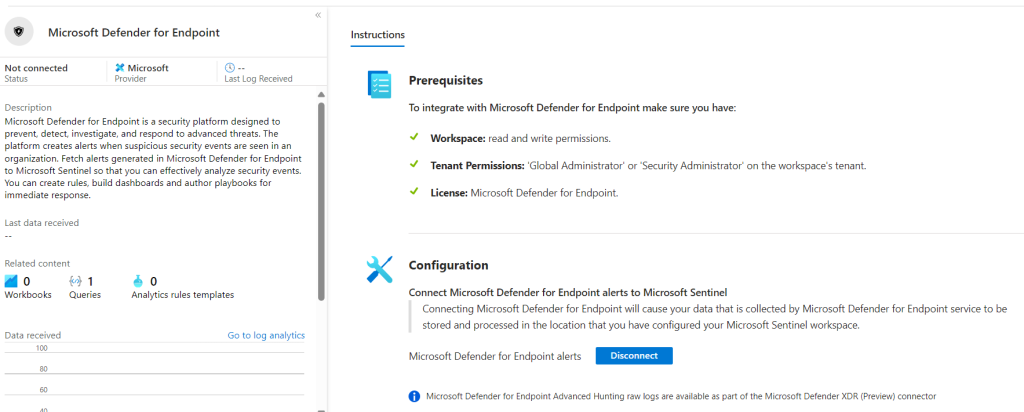
Microsoft Defender for Endpoint simply requires being enabled using the button in the “Configuration” section shown below.
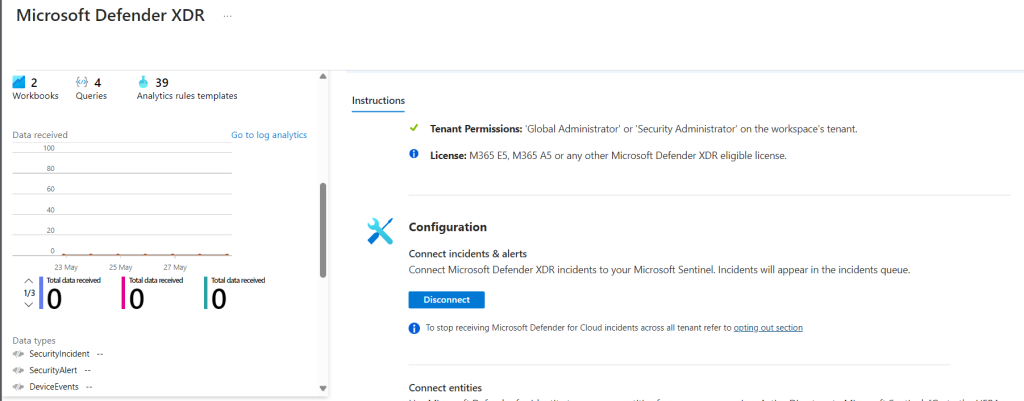
The same applies to Microsoft Defender XDR.
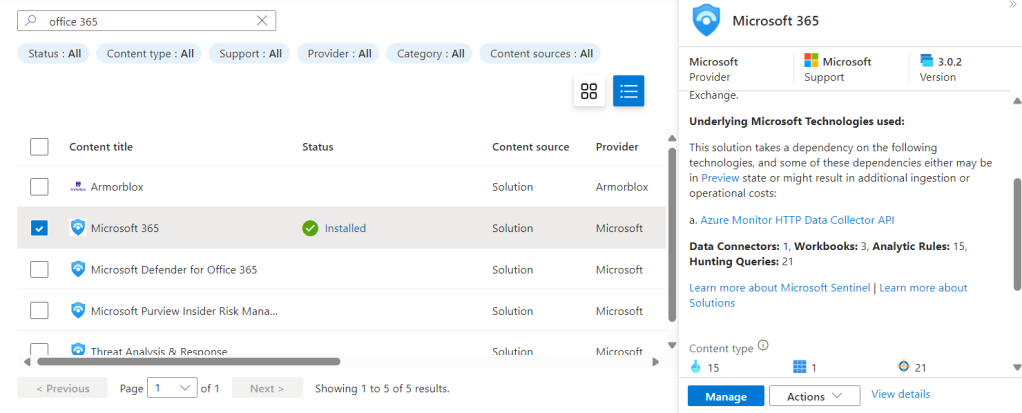
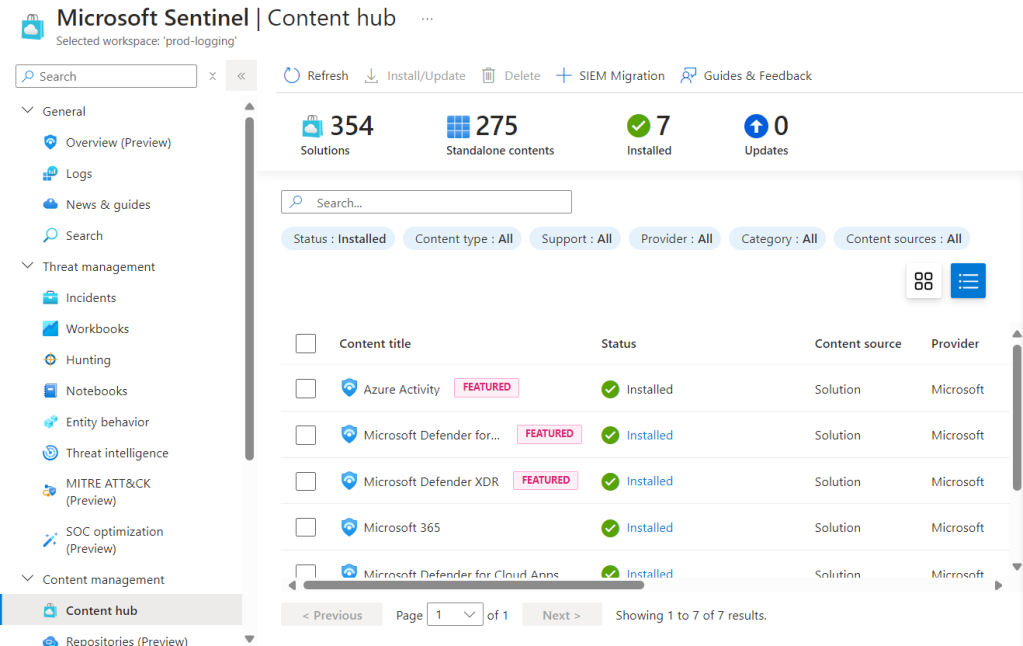
Once we have finished installing all the free feeds we can check we have them all by using the “Status” filter set to “Installed”.
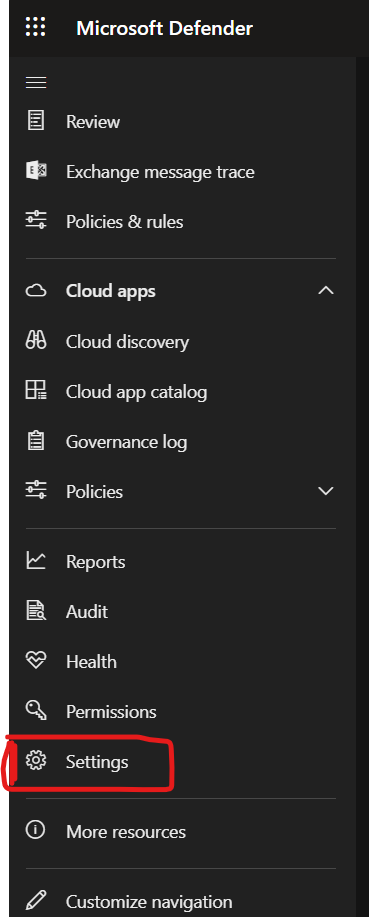
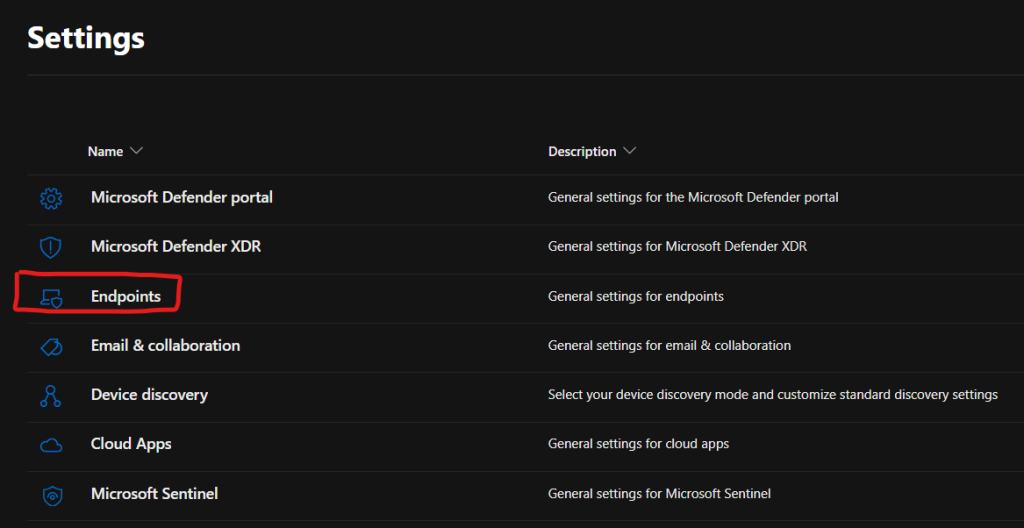
OK, so let’s do a quick test to see if we get an alert in Sentinel from our new connectors. We head over to https://security.microsoft.com > Settings > Endpoints
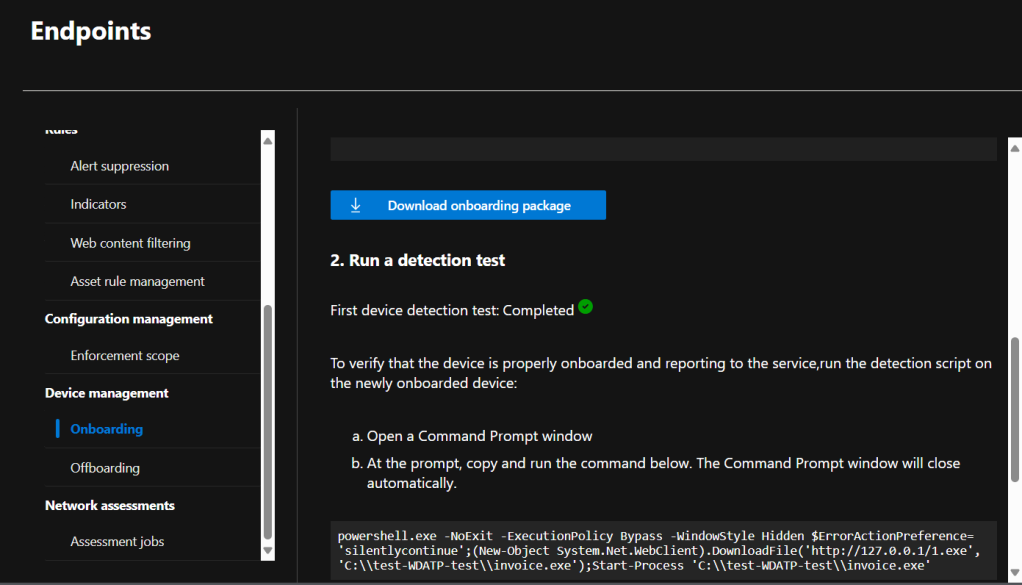
From here we can run a detection test which is a simple way to safely create an alert in Microsoft Defender for Endpoint (MDE), which should now be forwarded to Sentinel. We follow the simple instructions, copy the text and run it in a cmd prompt on our test endpoint.
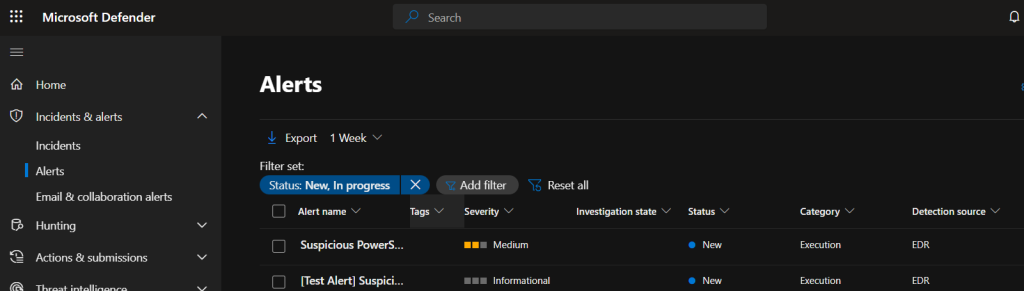
After a short period we see the alert in the MDE dashboard.
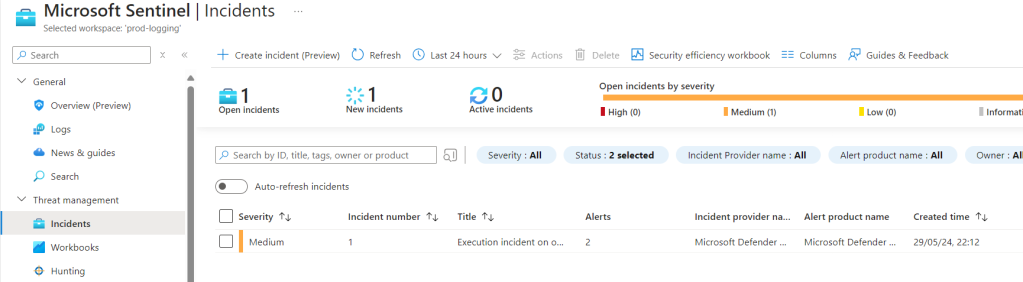
We head back over to Sentinel and can see we have the forwarded alert. It’s good practice to test any new connectors to ensure we are getting data through to Sentinel as expected.
The last part is to add the Sentinel Auditing and Health Monitoring Workbook which allows us to visualise the health of certain aspects of Sentinel and view data ingestion of our connectors.
The following resource types are currently supported for health monitoring:
- Analytics rules (New!)
- Data connectors
- Automation rules
- Playbooks (Azure Logic Apps workflows)
From the “Content Hub” we search for “Data collection health monitoring” then select and install as per the previous parts of this guide.
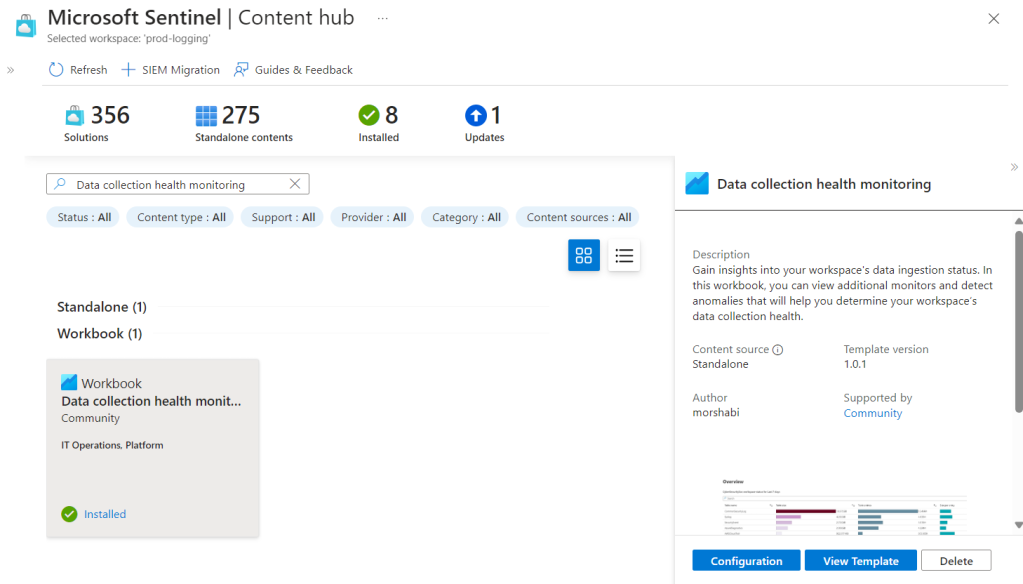
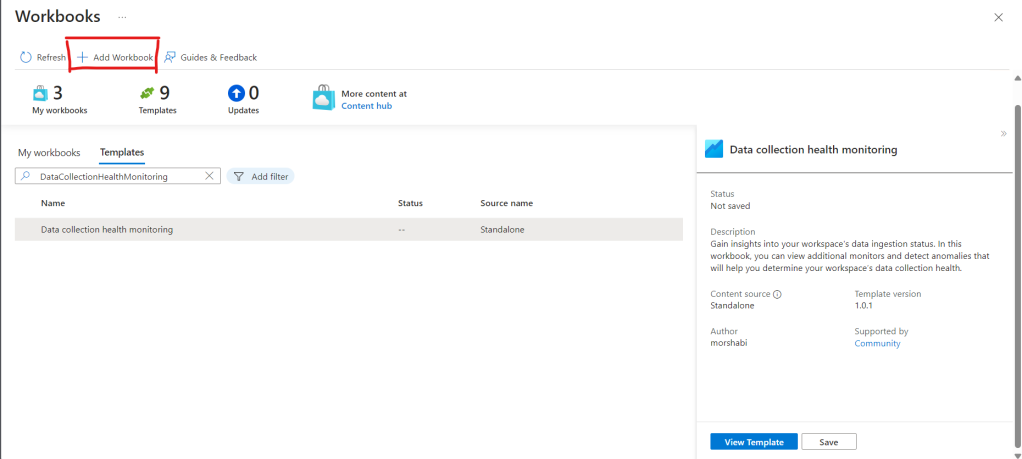
Once installed we go to the configuration page, and select “Add Workbook”.
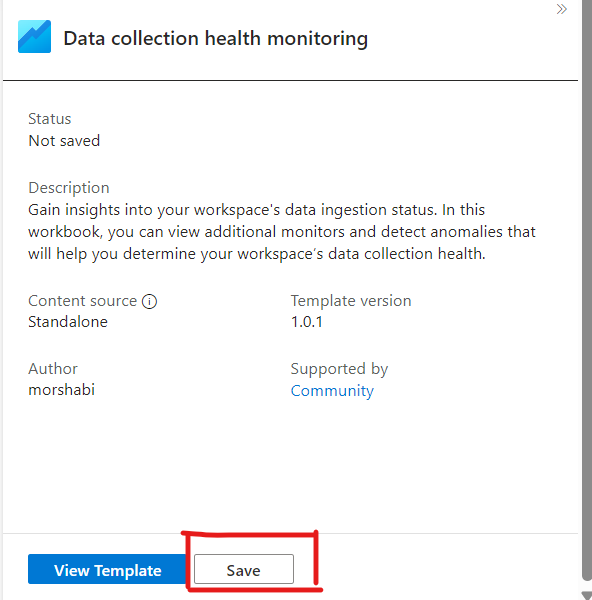
Then Save.
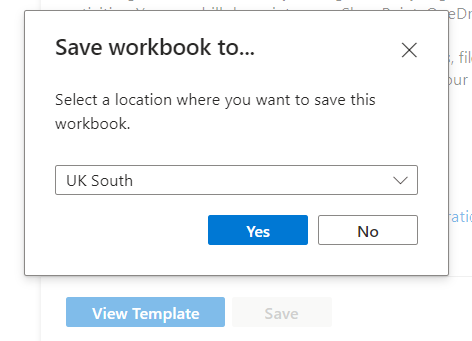
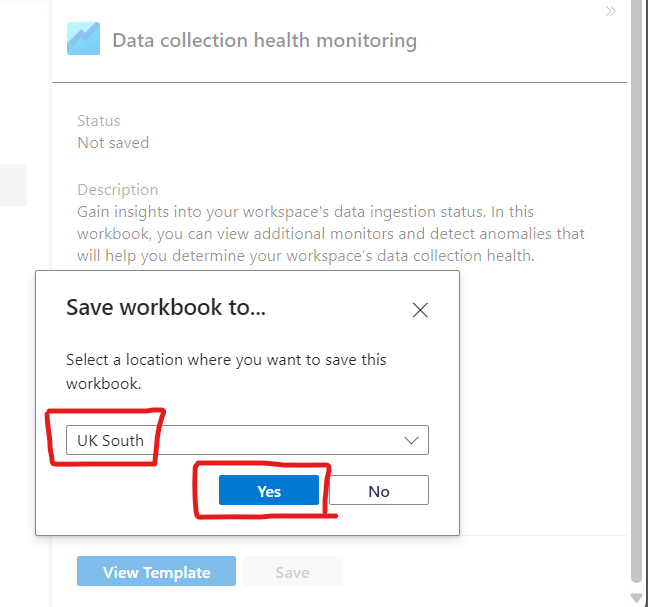
We will be prompted to select the region where we want our data to reside, we select the appropriate region and hit Yes.
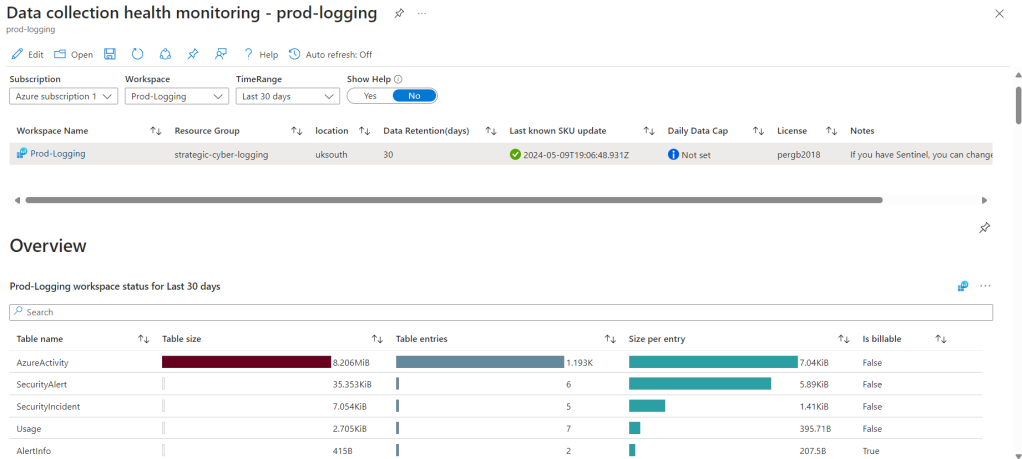
Back on the Sentinel Home page we select “Workbooks” from the menu then from the “My Workbooks” list select the data collection workbook and then hit “View saved workbook”.

Using the top menu filter options we select the relevant subscription, workspace, and time range. If we want to save these settings so the workbook displays using these filters by default we can use the save icon in the top menu.
We will then see a visualisation of the available data which we can use to monitor usage and data flows within Sentinel, including which are free and which are incurring a cost.
We now have Sentinel deployed using the available free data feeds. In subsequent guides we will look at Sentinel in more depth, as well as other useful resources to help us get the most out of Sentinel.
